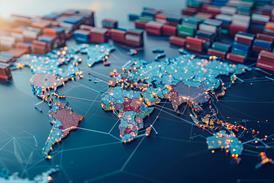
Compliance and risk professionals in search of a free resource for assessing the level of business-related bribery risk in the countries where they operate will want to have a look at the 2018 TRACE Bribery Risk Matrix, released Dec. 6.

Anti-bribery standard-setting organization TRACE International first launched its Bribery Risk Matrix in 2014 to meet a need in the business community for more reliable, nuanced information about the risk of commercial bribery worldwide. “Our aim in publishing the TRACE Matrix has always been to provide the compliance community with a more detailed understanding of country-specific business bribery risks than can be gleaned from a single score or rank,” said TRACE President Alexandra Wrage.  

To arrive at each country’s score, the matrix analyzes four specific areas (domains) where bribery is known to flourish, along with related sub-domains:

  • Domain 1: Business interactions with government (contact with government; expectation of paying bribes; and regulatory burden)
  • Domain 2: Anti-bribery deterrance and enforcement;
  • Domain 3: Government transparency and civil service (transparency of government regulatory functions and transparency and health of civil services sector); and
  • Domain 4: Capacity for civil society oversight (quality and freedom of the media; and human capital and social development).

For each domain and their related sub-domains, the TRACE Matrix aggregates data obtained from public interest and international organizations, including the United Nations, the World Bank, and the World Economic Forum. Based on statistical analysis of this information, each country was assigned not only an overall score between 1 and 100—with 100 representing the greatest risk—but also scores for each of the four domains and nine sub-domains.

The aggregated data is intended to help compliance and risk departments tailor their due diligence practices to the specific bribery risks of each country, so they can better allocate their limited compliance resources before entering a new market or seek to invest more in an existing market.

“The matrix is designed to present information about our best understanding of the current bribery risks in a country,” Robert Clark, manager of legal research at TRACE International, said during a webinar that explained the results. “It is not intended to give a comparison over time.”

Often, when people analyze the findings of the matrix, they’ll look to see how many spots each country moved up or down the rankings, whether a country fared better or worse than the previous year, but assessing the results of the report in that way is “problematic,” Clark said, particularly concerning countries that rank in the middle. “The slightest difference in data points can cause a jump of 10 or 20 places, without really changing the level of risk in any meaningful way,” he explained. To more accurately decipher whether a country fares better or worse “requires taking a closer look at the underlying data points and looking at the trends in those underlying data points.”

That is where the TRACE Matrix Data Browser comes into play. To complement this year’s matrix, TRACE, for the first time, introduced its Matrix Data Browser, an online tool that allows users to sort and group the data from which matrix scores are derived to identify trends and patterns that may be relevant in understanding the risk environment each country presents. “By making the data points underlying the country scores more accessible, this year’s introduction of the Matrix Data Browser will allow users to deepen their contextual understanding even further,” Wrage said.

“As the global head of anti-corruption and government compliance for a company that does business in more than 120 countries worldwide, understanding the risks of each market is a critical part of my job,” said Daniel Seltzer, senior director of anti-corruption and government compliance at management consulting firm Accenture. TRACE’s Bribery Risk Matrix “offers both an easy-to-understand single number rating that accurately quantifies risk and granular detail in four critical categories for those wanting to do a deeper dive,” Seltzer added. “It is a critical part of our risk assessment process at Accenture.”

Country-by-country findings

Among the 200 total countries ranked in the 2018 TRACE Bribery Risk Matrix, Africa, with an overall average score of 62, is the most high-risk continent. Europe, with an overall average score of 32, was the most low-risk continent. In comparison, the average global score for all countries is 50.


“[TRACE’s Bribery Risk Matrix] offers both an easy-to-understand single number rating that accurately quantifies risk and granular detail in four critical categories for those wanting to do a deeper dive. It is a critical part of our risk assessment process at Accenture.”

Daniel Seltzer, Senior Director of Anti-corruption and Government Compliance, Accenture


Those that posed the highest risk of commercial bribery overall include Somalia (92), Libya (83), Venezuela (82), Chad (82), Turkmenistan (82), and North Korea (81). In comparison, countries that posed the lowest risk of bribery include New Zealand (5), Sweden (5), Norway (7), Denmark (8), and Finland (9).

The United Kingdom and the United States also fared well, ranking 7th and 18th, respectively, with overall low risk scores of 12 and 21.

Domain 1. Breaking down the highest and lowest rankings per domain, the TRACE Matrix found that among all countries, New Zealand posed the lowest risk of bribery in Domain 1 concerning its interactions with government, whereas Macau posed the highest risk.

Digging a bit deeper beyond the top highest and lowest rankings, other countries with low bribery risk scores in Domain 1 include Singapore (4) Sweden (7), Hong Kong (7), United Arab Emirates (8), and Denmark (8). Those that pose a high risk of bribery in Domain 1 and, thus, have many government touchpoints, include Venezuela (99), Turkmenistan (93), Bermuda (92), and Somalia (90).

Domain 2. Luxemburg showed the lowest level of commercial bribery risk concerning the quality of its anti-bribery deterrance and enforcement, whereas North Korea showed the highest level of risk. Other countries that scored well in this domain include Denmark, Singapore, Norway, Finland, and the Netherlands. Those that scored poorly include Somalia, Equatorial Guinea, Eritrea, and Burundi.

Domain 3. Concerning the level of government transparency and civil service, both Sweden and Norway received the highest score, whereas Somalia received the lowest score. Other countries that scored among the highest for government transparency and civil service include New Zealand (6), Netherlands (7), the United Kingdom (7), and Finland (9). Those that scored among the worst in this domain include Chad (95), Eritrea (93), Guinea-Bissau (93), Burundi (92), and Equatorial Guinea (91).

Domain 4. Countries that boast the highest capacity for civil society oversight, ranking in the top three in this domain, are Norway, Denmark, and Sweden. Countries that scored especially poorly include Eritrea, North Korea, and Burundi.

What a country’s individual score means, and how it will affect compliance and risk-management efforts, is for each organization’s compliance team, in collaboration with other business units, to decide, as they apply their own analysis to the numbers, “but we here at TRACE hope that you find the Bribery Risk Matrix to be useful in informing your efforts,” Clark said, “and that you find the Matrix Data Browser an informative, and even a fun, way to come to understand that data a lot better for yourself.”