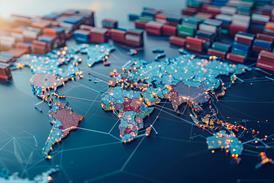
Chief compliance and risk officers have a newly published resource by which to assess the level of business-related bribery risk in the countries where they operate.

TRACE International, a non-profit business association, this month published its latest TRACE Matrix, a bribery risk index specifically tailored to the needs of companies. Developed in collaboration with research firm RAND, the TRACE Matrix ranks each country based not only on an overall business bribery-related risk score, but also on specific bribery-related risk factors unique to each country.

“By providing granular business bribery risk information, the TRACE Matrix has helped us refine our internal anti-corruption risk matrix and to identify in which markets we will conduct in-person, anti-corruption monitoring visits,” said Gregory Bates, director of ethics and compliance for Latin America at cosmetics company Avon Products.

First published in 2014—and updated every two years—the TRACE Matrix ranks countries on a scale of 1 to 100, with a higher score indicating a higher risk of business-related bribery. To arrive at each country’s score, the matrix analyzed the following four “domains” most likely to increase the demand for—and tolerance of—public-sector bribes:

Domain 1: Business interactions with government;

Domain 2: Anti-bribery laws and enforcement of those laws;

Domain 3: Government transparency and civil service (e.g., whether government budgets are publicly available); and

Domain 4: Capacity for civil society oversight (the extent of freedom of the press and social development).

RAND further refined the research by including nine sub-domains. Sub-domains assessed in the domain “business interactions with government,” for example, include “contact with government,” “expectations of paying bribes,” and “regulatory burdens.”

Enjoy full access to Compliance Week's Digital Edition, a faithful reproduction of our monthly print magazine—conveniently online. Subscribers can browse, print, and download issues back to April 2013, add annotations, search by keyword, and more.

TRACE Matrix vs. TI CPI. For many years, compliance and risk executives have turned to Transparency International’s Corruption Perception Index (TI CPI) as a resource to help shape their due diligence efforts in the countries in which they operate. The TI CPI ranks countries on a scale of zero (perceived to have high levels of corruption) to 100 (perceived to have little corruption).

“By providing granular business bribery-risk information, the TRACE Matrix has helped us refine our internal anti-corruption risk matrix and to identify in which markets we will conduct in-person, anti-corruption monitoring visits.”
Gregory Bates, Director, Ethics and Compliance, Latin America, Avon

Though helpful, the TI CPI for compliance officers draws primarily on data based on overall public perception, with less emphasis on actual bribery incidents. Furthermore, the types of corruption the TI CPI measures don’t always relate specifically to companies.

Also the TI CPI’s information makes it difficult to infer whether bribery risk is perceived to be worsening, or whether anti-bribery efforts are improving, year-over-year. What the TRACE Matrix does show, however, is how distribution of bribery risk is changing, says Robert Clark, manager of legal research at TRACE.

With the TRACE Matrix, companies that are conducting risk assessments, looking to break into a new market, or determining what level of due diligence to do on a potential business partner in a particular country can tailor their limited budgets and resources accordingly. “They can look at these scores, determine how it applies to their specific risk profile, their line of business, and build in specific procedures to address some of the risk,” says Virna Di Palma, senior director of global strategy and communications at TRACE.

Many compliance and risk officers use both indices, because in a sense, it gives them another level of verification as to the level of risk in a particular country, Di Palma says. Furthermore, the correlation between the two indices is pretty strong; for countries that are perceived to have high levels of corruption in the TI CPI, “most likely the TRACE Matrix score isn’t going to be very far off,” she says.

Under the first domain in the TRACE Matrix, for example, the more interactions with government officials, the greater chance of being solicited for a bribe in a particular country. “Essentially, the red tape companies are dealing with when doing business there tends to result in an overall higher score in the TI CPI,” Di Palma says.

Thus, if a country has a high risk score in this particular domain, companies with operations in that country may want to allocate additional resources to training employees there, or step up their risk management efforts when clearing goods or services through customs to obtain permits and licenses.

Similarly, if a country has a high bribery risk score in domain four, indicating little freedom of the press, “they can assume government officials operate with more impunity,” Di Palma says. In those circumstances, it may be a good idea to work closely with that country’s local Chamber of Commerce or an industry group, she says.

Country-by-country

Overall, results from the 2016 TRACE Matrix revealed a bit of good news: Many of the 199 countries ranked by TRACE improved their bribery score since 2014. These countries include the top five countries—Sweden, New Zealand, Estonia, Hong Kong, and Norway—whose bribery risk scores were among the lowest.

TRACE MATRIX INFOGRAPHIC

Below is an overview of findings from the 2016 TRACE Matrix.
The average global bribery risk score for all countries was 58.
Sweden took the top spot, with an overall low bribery risk score of 10.
Nigeria took the lowest spot, with an overall high bribery risk score of 97.
32% of countries received reduced bribery risk scores.
60% of countries increased their bribery risk scores.
28% of countries scored below 50 out of 100.
71% of countries scored above 50 out of 100.
Source: TRACE International

Some these same Northern European countries similarly fared well in the 2015 TI CPI. In that index, the top countries that had the lowest perceived levels of corruption were Denmark, Finland, Sweden, New Zealand, Netherlands, and Norway.

In the TRACE Matrix, Estonia’s anti-bribery efforts progressed the most of all countries. Its overall bribery risk score improved from 33 in 2014 to 17 this year, resulting in a jump in country rank from 22nd in 2014 to 3rd in 2016.

Whereas Estonia received a moderate bribery risk of 58 in 2014 for anti-bribery laws and enforcement, that domain score improved considerably to a low of eight in 2016. It also improved significantly—from a bribery risk score of 39 in 2014 to a low bribery score of five—in the domain of government and civil service transparency.

Middle East and Africa. The majority of countries, however, saw their bribery risk scores increase, even if only slightly. Syria, whose overall score rose from 73 to 88, suffered the most considerable setback in its bribery risk environment, according to TRACE.

Below Syria, other countries that pose the highest risk of bribery include Nigeria (97), Angola (96), Yemen (93), Guinea (92), Cambodia (89), Myanmar (92), and South Sudan (90). Each of these countries also scored poorly in the TI CPI.

In the TRACE Matrix, Nigeria and Angola, for example, received high risk scores of 100 in the domain of poor government and civil service transparency. They also scored particularly high in the domain of business interactions with government; Nigeria received a high score of 98, while Angola received a score of 90.

South Sudan similarly received a high bribery risk score of 96 for business interaction with government. In comparison, Yemen revealed high bribery risk scores of 100 in each of the domains anti-bribery laws and enforcement, as well as civil society oversight.

In addition to Syria and Yemen, other Middle East countries with overall high bribery-risk scores include Kuwait (76), Iraq (75), Iran (73), and Saudi Arabia (63). In other areas of the Middle East, Jordan received a moderate overall score of 66, while Israel received a low bribery score of 33.

In North Africa, Chad fared the worst with an overall bribery risk score of 87 and ranking at 191. Other countries in the region with high bribery risk scores include Libya with a score of 78 and a rank of 179th; Egypt with a score of 74 and a rank of 160th; Mali with a score of 74 and a rank of 164th; and Algeria with a score of 73 and a rank of 158th.

The 2015 TI CPI revealed similar findings: Three of the bottom 10 countries—Iraq, Libya, and Sudan—are from the MENA region.  “The ongoing devastating conflicts in these and other countries, such as Syria and Yemen, inevitably mean that any efforts to strengthen institutions and the state have taken a back seat,” said Ghada Zughayar, director of the MENA department at TI.

The 2015 TI CPI revealed further revealed that most MENA countries continue to maintain the same poor score, and some—Egypt, Libya, Morocco, Syria, and Tunisia—have deteriorated slightly. “Political corruption, in particular, remains a huge challenge,” Zughayar added. “The rise of ISIS and the ensuing fight against terrorism have been used by many governments as an excuse to crack down on civil liberties and civil society. Far from helping, such an approach means that entrenched corrupt networks go unchallenged, often serving as yet further financial fodder for terrorism.”

BRIC nations and Mexico. Of the BRIC nations, India received the highest risk score of 78, ranking 178th overall. Its highest bribery score (86) concerns business interactions with government, while receiving moderate scores in all other domains. With a score of 74 and ranking 167th, Brazil similarly received its highest bribery score (91) in business interactions with government, but a low bribery score of 14 for its high-quality anti-bribery laws and enforcement.

China received its highest score of 77 in the domain of civil society oversight “based on a very low degree of media freedom,” TRACE stated. It received a low bribery score of 25, however, for its “high quality of anti-bribery laws and a moderate quality of anti-bribery enforcement.”

With a moderate overall bribery score of 58, and ranking 94th overall, the Russian Federation received its highest—but still moderate—risk score (63) for business interactions with government, “based on a low degree of government interaction, moderate regulatory burden, and a high expectation of bribes,” TRACE said.

Mexico scored moderately across the board, with an overall risk score of 59 and ranking 103rd. Its highest risk score of 63 concerns government and civil transparency.

In the 2015 TI CPI, long-standing corruption in many countries in South America and Mexico “has led to a desperate lack of investment in security, education, and health,” said Alejandro Salas, regional director for the Americas at TI. “Until these weaknesses are addressed, corruption will continue to be the norm.”

Western nations. With an overall bribery risk score of 28 and ranking in 12th, Canada scores among the lowest bribery risk regions in the world. Three placements below it, with a score of 31 and a rank of 15, is the United Kingdom, whose bribery risk score improved by one point, from its score of 32 in 2014.

The United States, in comparison, suffered a setback in its bribery risk environment, experiencing an increased score of 27 in 2014 to 34 in 2016. In 20th place, it ranks four spots below the United Kingdom, and eight below Canada, but still remains among the least risky areas for bribery in the world.  The TI CPI revealed comparable results, with Canada ranking 9th overall, the United Kingdom ranking 10th, and the United States ranking 16th.

As helpful as the TRACE Matrix and TI CPI can be for compliance and risk officers, they are still just one element of analysis that should go into an enterprise-wide risk management program. “We encourage companies to apply their own experience and own analysis to the numbers,” Di Palma says.

The intent of the TRACE Matrix, in particular, is to provide just enough information and enough data so that companies can understand what sort of factors drive bribery risk in a particular country, Di Palma adds. In that way, she says, they can then apply those bribery-related scores to determine how it applies to their own specific corporate risk profiles and how to improve their own risk assessments and due diligence procedures moving forward.